Measuring how far users scroll down a landing page
We have recently launched our website. At the top of each page, there is a huge (and nice) illustration accompanied by a short copy. For example, the home page looks like this:
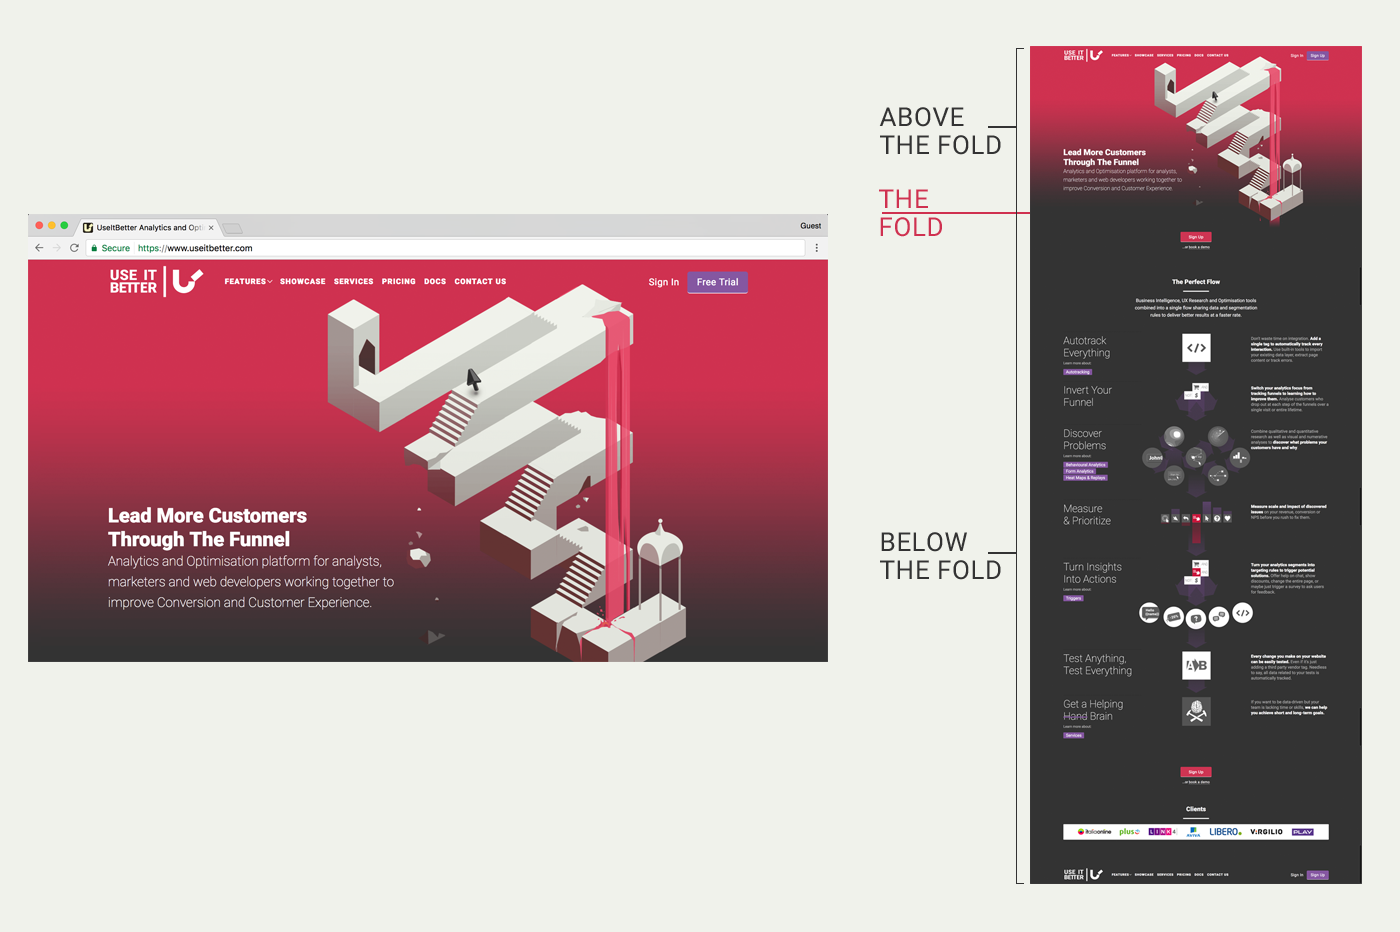 UseItBetter Homepage Requires Lots of Scrolling
Our obvious concern was, are users aware that there's content below the fold?
No analytics (yet) can't tell what people are aware of, but at least we can check if they scroll down the page and, if they do, how far. If you have analysed the scroll reach on your website before, you probably used heatmaps for that purpose, but there's another way to do that.
UseItBetter Analytics has this metric called "Scroll Reach". It tells you what percentage of a page a user saw during each page view. Or, to be precise, how much of a page was visible in a browser viewport.
To aggregate that data in UseItBetter I use the Stats report:
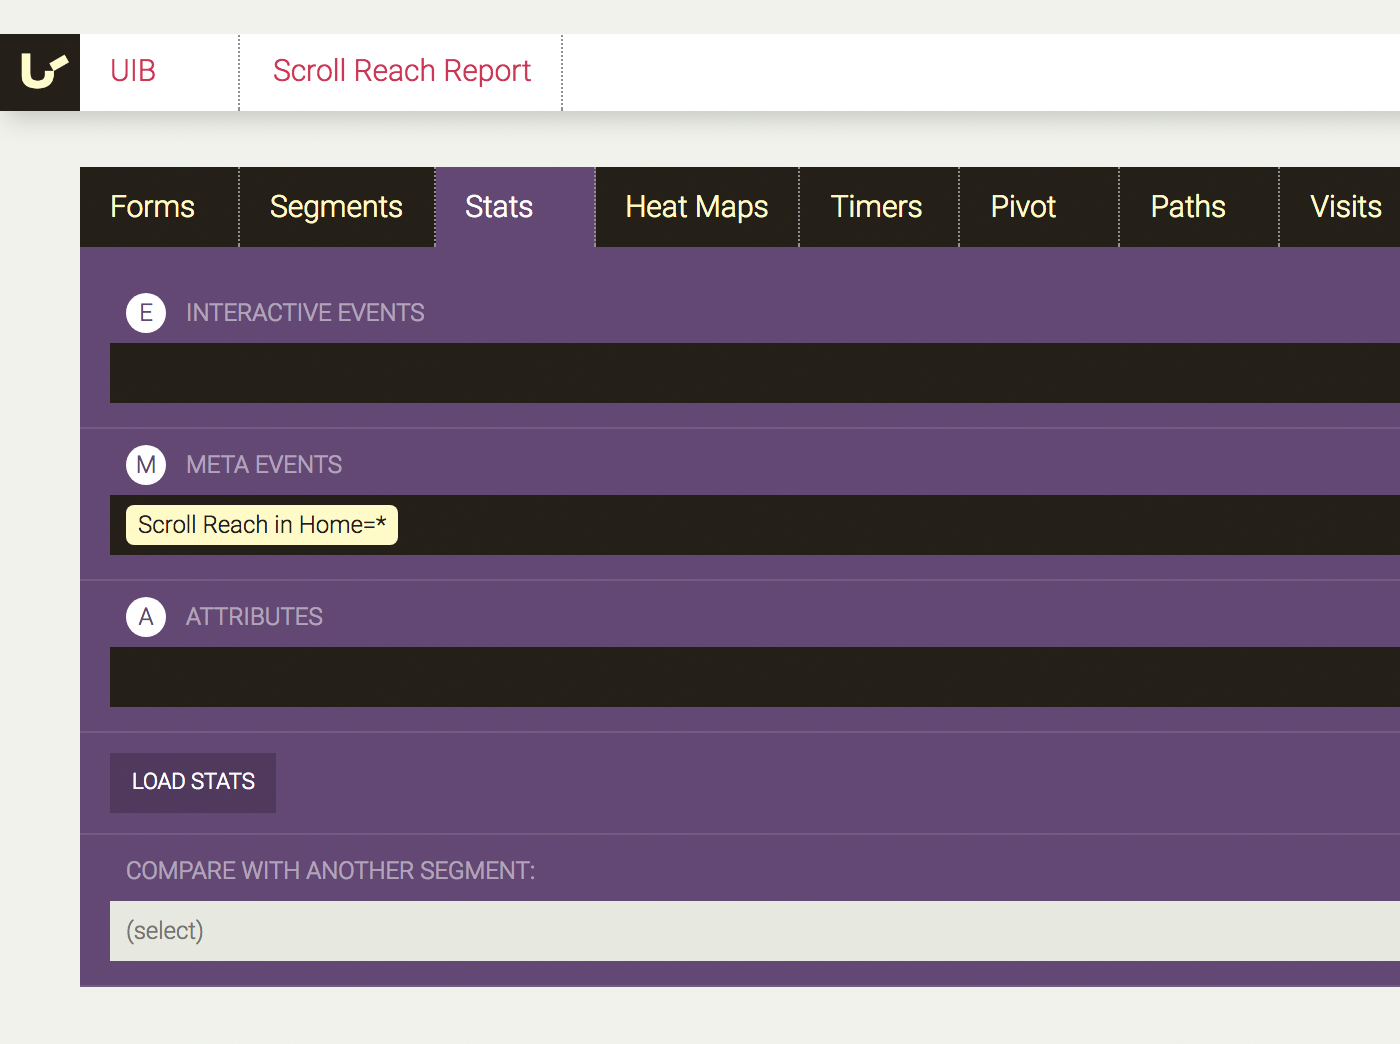 Using Stats Report you can pull scroll reach data for any page.
Scroll Reach returns data in a range between 0 and 100. 100 means that users have seen the bottom of the page.
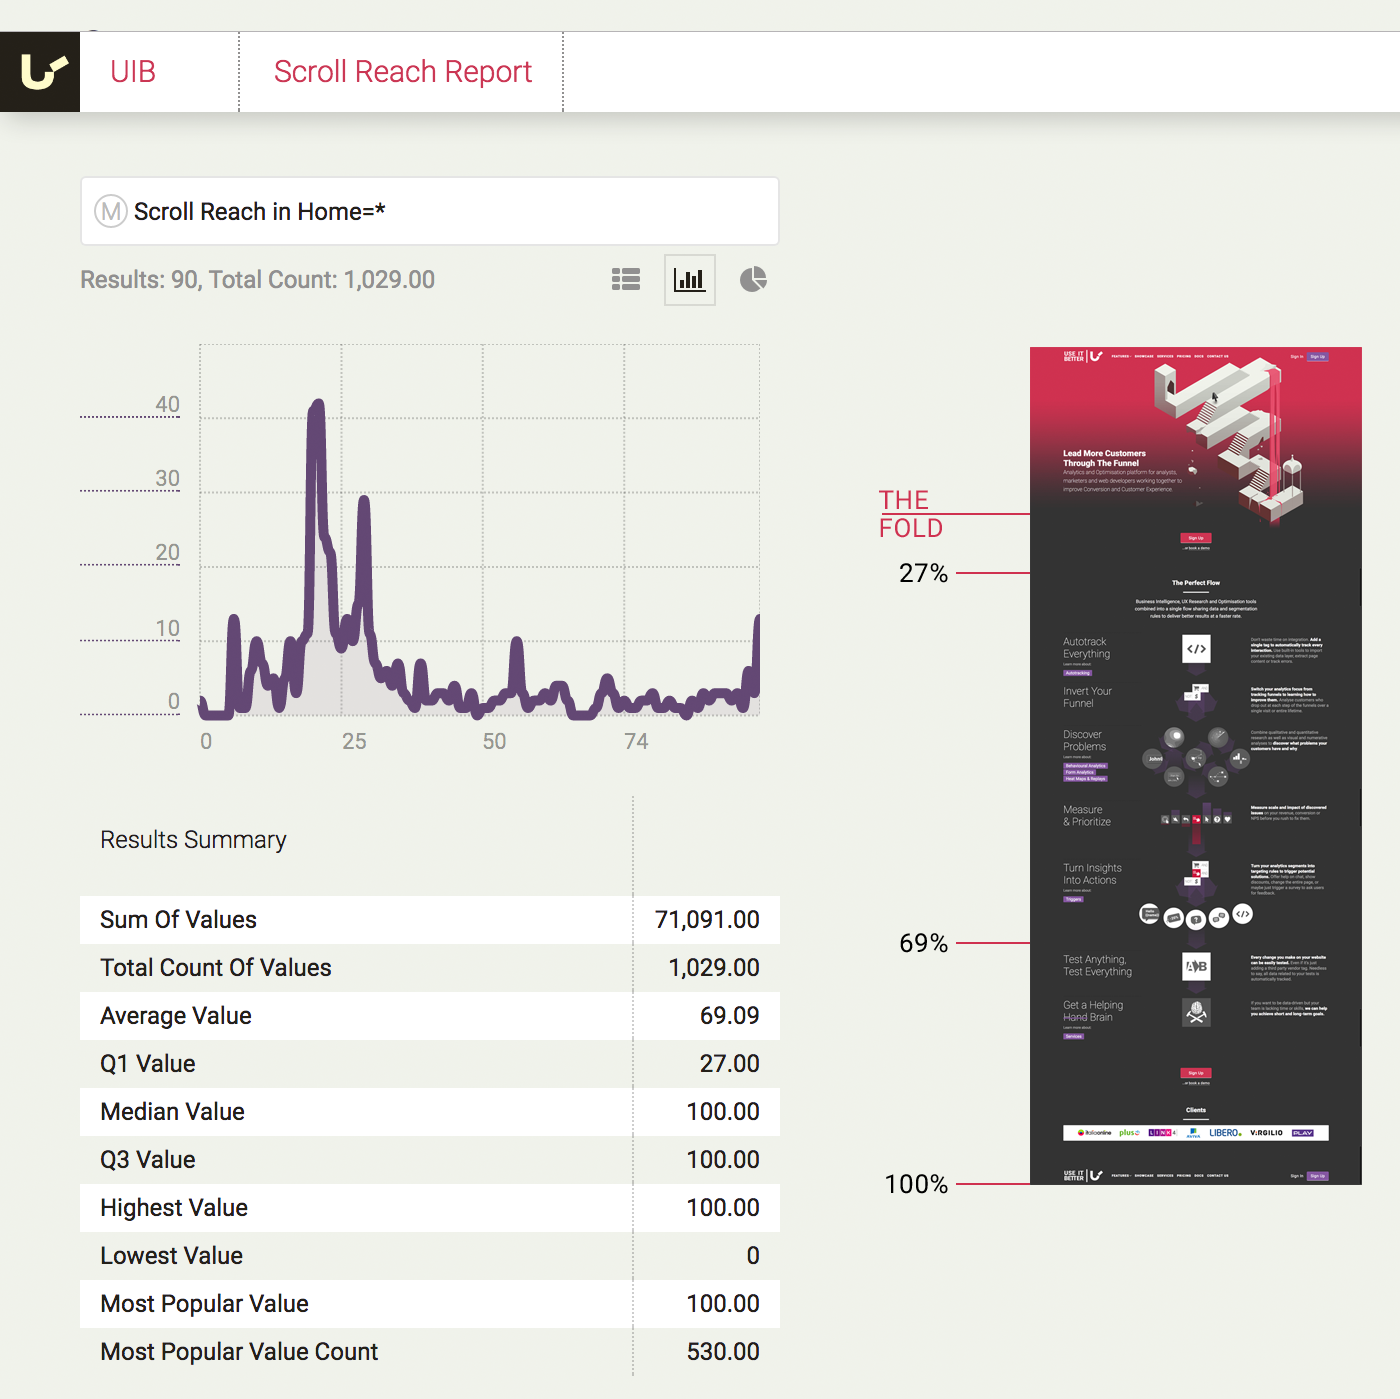 Scroll Reach statistics allows you to understand how far down the page people are scrolling.
The data, above, shows that users saw, on average, 69% of the home page. The visualisation, on the right, shows how far that is. I think median and quartiles are more meaningful though:
- in 25% of page views, only 27% (or less) of the page was seen - these are page views in which users probably didn't scroll the page at all. They either bounced or used the top navigation. This could be easily checked of course.
- in at least 50% of page views, users scrolled down to the very bottom. Not bad.
But...
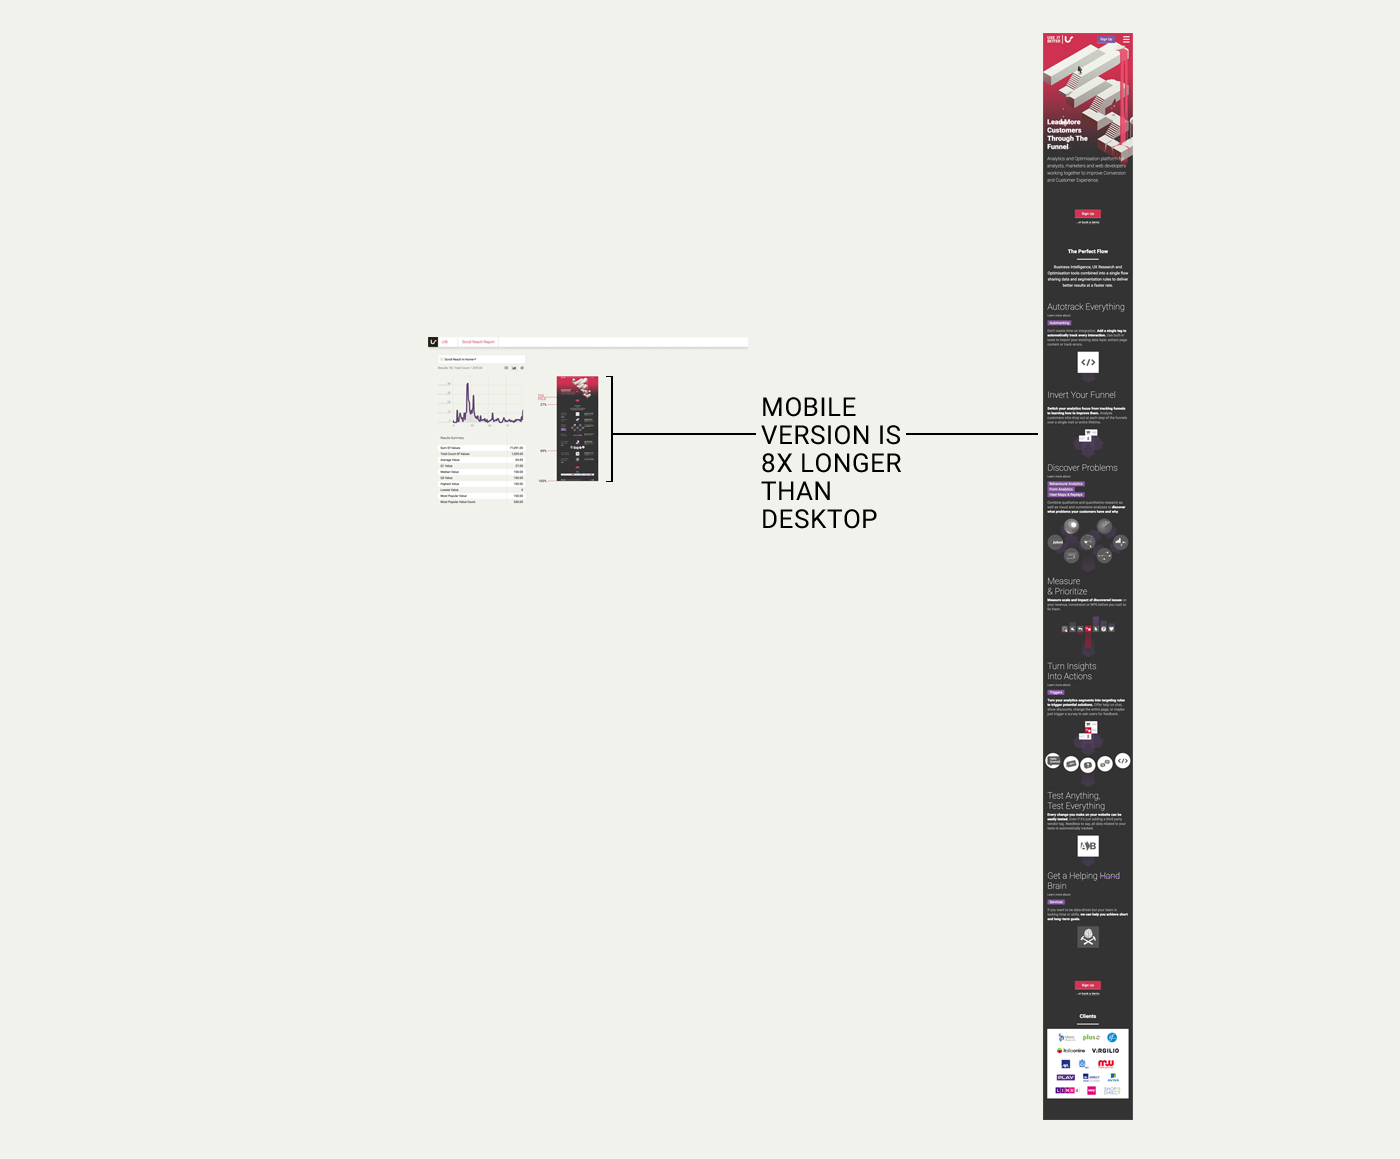 On mobile, pages require a lot more scrolling.
... the mobile version is 8 times longer and we should look at the data for big and small screens separately.
Our site switches to a mobile view if a user's screen width is 480px or less. My two segments for analysis need to look like this:
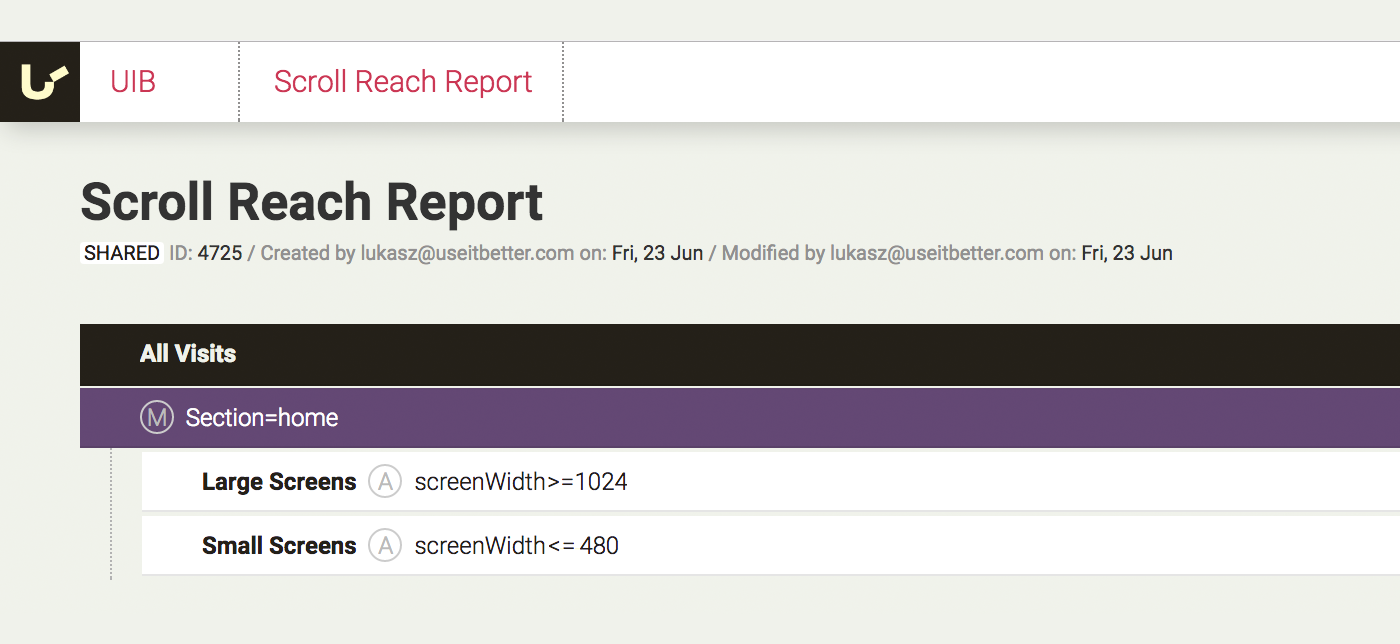 Segmentation by screen resolution allows you to get more accurate insights.
Now, I can use the Stats again to compare the Scroll Reach. Data for large screens is on the left, small screens on the right:
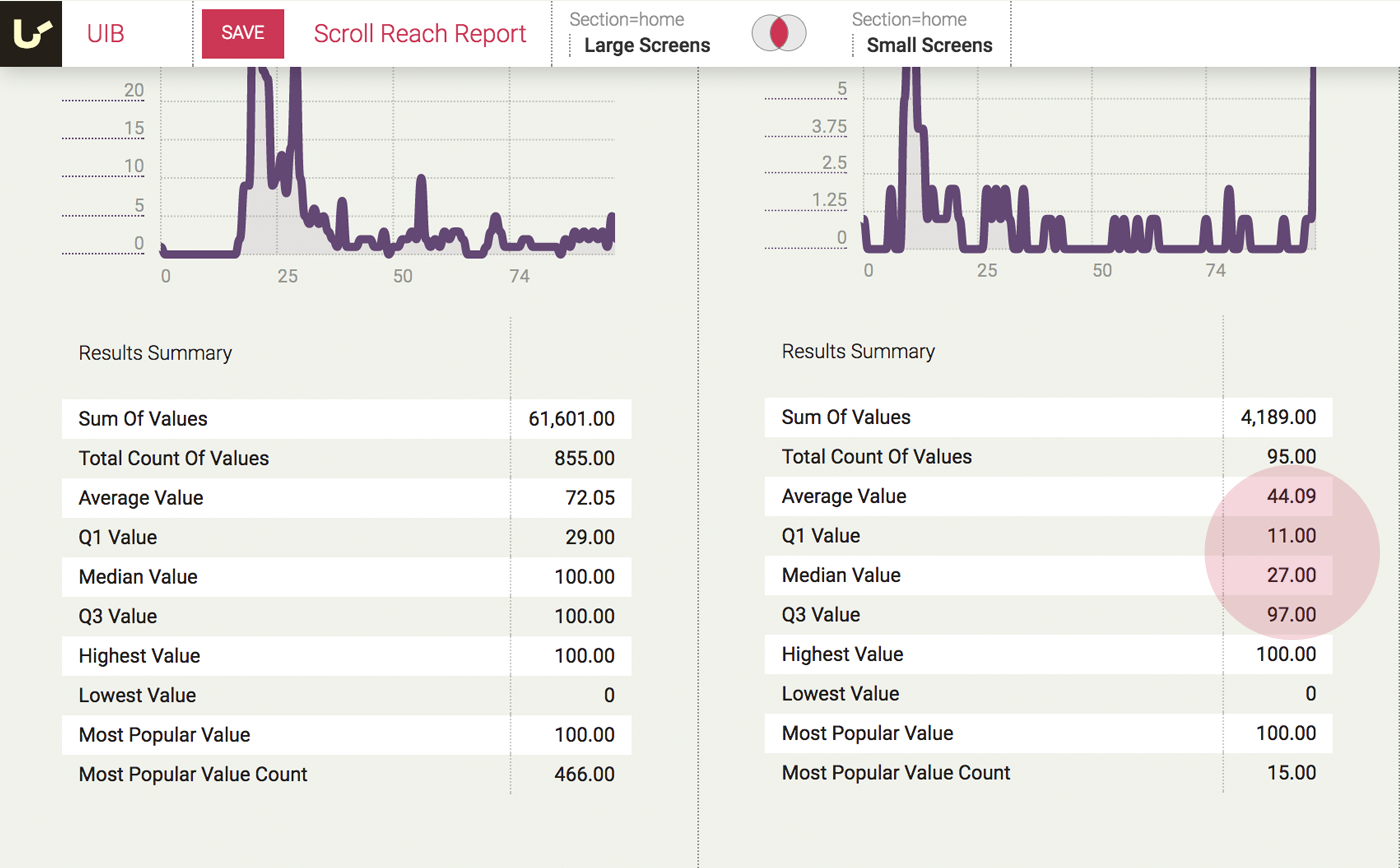 Side by side comparison of scroll reach on desktop and mobile.
The numbers for big screens are pretty much the same as before. Unfortunately, the performance of the mobile version is much worse. In half of mobile views of the home page, users didn't scroll far enough to see the information about the workflow they can cover with UseItBetter. So if we want to optimise the home page for mobile, we need to optimise the first 27% of the page.
Scroll Reach can be aggregated for multiple pages of the same category to compare, say, scroll reach in all shoes and all dresses products. It can be aggregated for the entire site and used as a KPI, perhaps to evaluate marketing campaigns, especially on websites that are oriented on increasing awareness rather than conversion.